Example configurations
Replacing Munin
This example shows how to use Duct to replace a Munin polling setup by
collecting metrics from munin-node and forwarding them to a
Riemann → InfluxDB → Grafana stack (DRIG).
Step 1: Stand up the DRIG stack with Docker
The easiest way to run Riemann, InfluxDB and Grafana together is with
Docker Compose. Create a docker-compose.yml file:
services:
  riemann:
    image: riemannio/riemann:latest
    ports:
      - "5555:5555"
      - "5555:5555/udp"
    volumes:
      - ./riemann.config:/etc/riemann/riemann.config

  influxdb:
    image: influxdb:1.8
    ports:
      - "8086:8086"
    environment:
      INFLUXDB_DB: riemann

  grafana:
    image: grafana/grafana:latest
    ports:
      - "3000:3000"
    environment:
      GF_SECURITY_ADMIN_PASSWORD: admin
Then create a minimal riemann.config that writes events to InfluxDB:
(logging/init {:file "/var/log/riemann/riemann.log"})

(let [host "0.0.0.0"]
  (tcp-server {:host host})
  (udp-server {:host host}))

(periodically-expire 60)

(def influx
  (influxdb {:host "influxdb"
             :port 8086
             :db   "riemann"
             :version :0.9}))

(streams
  (async-queue! :influx {:queue-size 1000}
    influx))
Start the stack:
docker compose up -d
Step 2: Install and configure Duct
Install Duct:
pip install ducted
Create /etc/duct/duct.yml:
ttl: 60.0
interval: 1.0

outputs:
  - output: duct.outputs.riemann.RiemannTCP
    server: localhost
    port: 5555

sources:
  - service: mymunin
    source: duct.sources.munin.MuninNode
    interval: 60.0
    ttl: 120.0
    critical:
      mymunin.system.load.load: "> 2"
This configures Duct to connect to munin-node on the local machine
and collect all configured plugin values every 60 seconds.
Start Duct:
ductd -c /etc/duct/duct.yml
Step 3: Add dashboards in Grafana
Open Grafana at http://localhost:3000 (default login: admin /
admin).
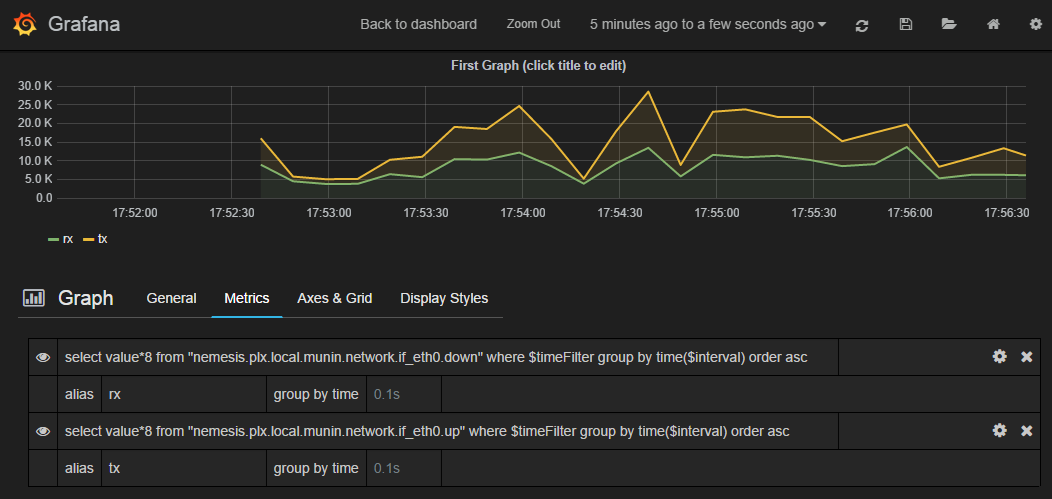
Add an InfluxDB data source pointing at
http://influxdb:8086, databaseriemann.Create a new dashboard and add panels querying the metric series written by Riemann. Series names follow the pattern
<host>.<service>, for examplemyhost.mymunin.network.if_eth0.down.
Many Munin metrics are counter types. The
duct.sources.munin.MuninNode source handles this automatically
by caching the previous value and emitting rates of change.
Using Prometheus instead of Riemann
If you prefer a Prometheus pull model, Duct can expose a scrape endpoint directly. Replace the Riemann output with:
outputs:
  - output: duct.outputs.prometheus.Prometheus
    port: 9110
    prefix: duct_
Then point your Prometheus scrape config at http://<host>:9110/metrics.
No separate time-series database or Riemann instance is needed.